Historical Crashes
What Actually Happened in 2008
It wasn't a surprise. It was the most heavily telegraphed disaster in modern financial history — and almost everyone got to watch it happen in slow motion while pretending they couldn't see it.
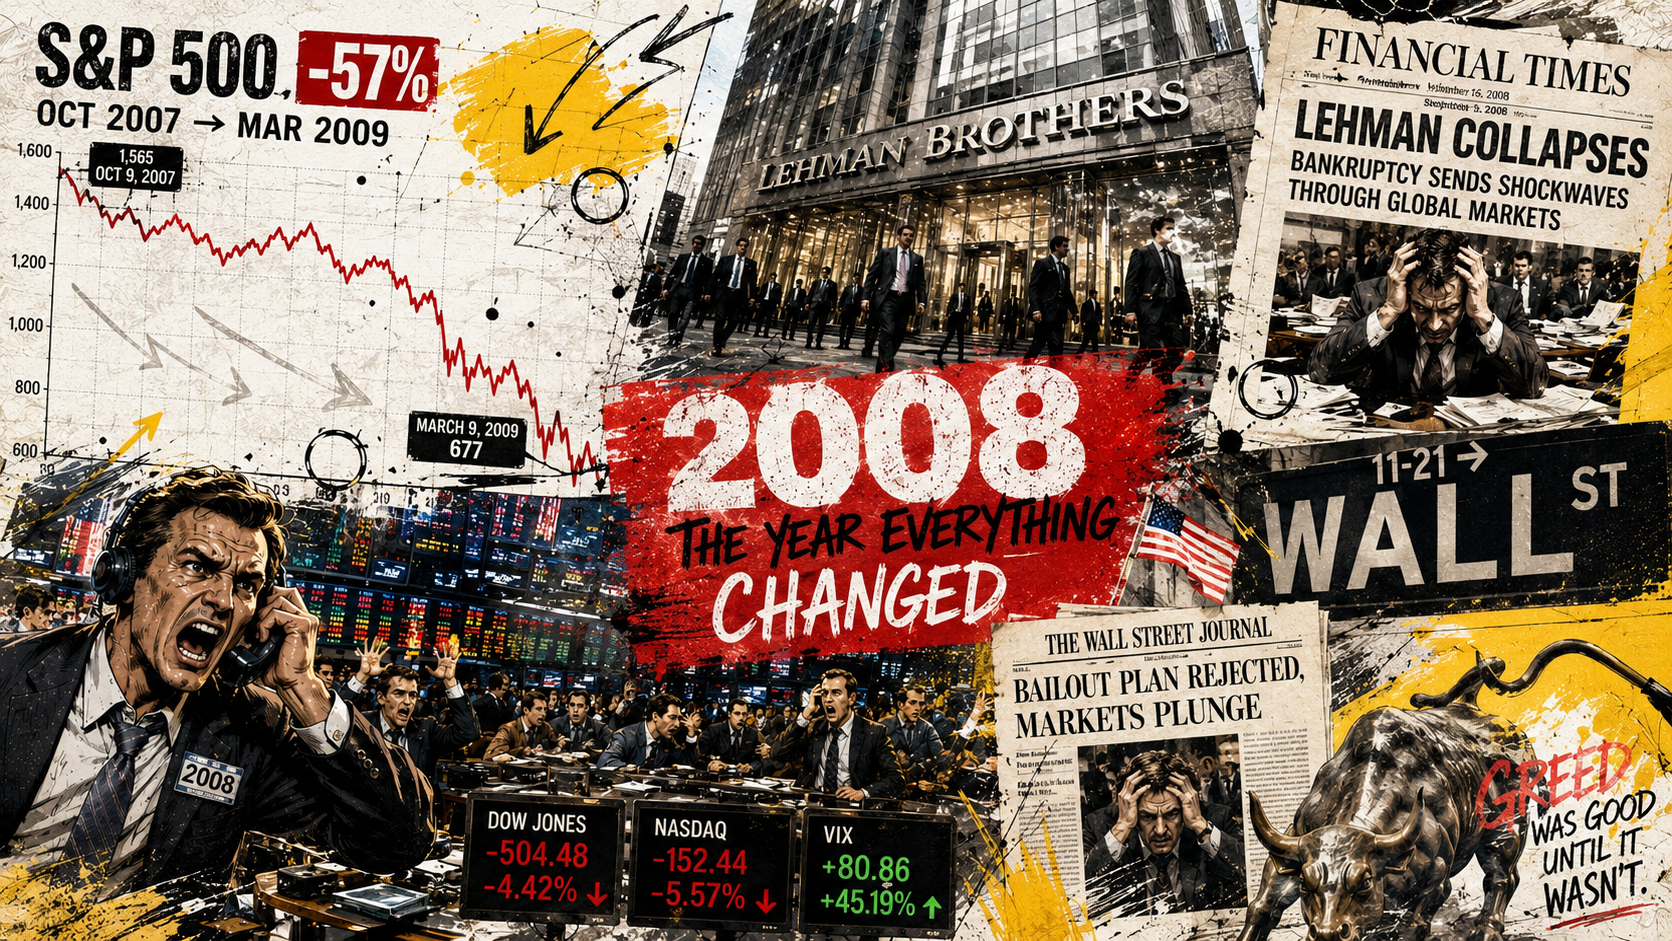
The S&P 500 fell roughly 57% from its October 2007 peak to its March 2009 bottom.
Here's a fun fact nobody wants to hear: the 2008 crash wasn't a black swan. It wasn't unpredictable. It was a freight train that everyone heard coming for eighteen months, standing on the tracks, arguing about whether the sound was really a train. Let me walk you through it — because every signal that mattered in 2008 is something you can watch yourself, right now, today.
Start with the setup. By October 9, 2007, the S&P 500 closed at an all-time high of 1,565. Everybody was a genius. Home prices had been climbing for a decade, banks were handing out mortgages to anyone with a pulse, and Wall Street had figured out how to package those mortgages into securities that were rated as safe as government bonds. What could possibly go wrong?
A lot, as it turns out. And the warning lights had already been flashing for over a year.
01 The signals were screaming in 2006
In 2006, two things happened that, in hindsight, were the whole story. First, U.S. home prices peaked and quietly began to roll over. Second — and this is the one the bond market nerds care about — the yield curve inverted.
Quick translation, because this matters: normally, longer-term loans pay higher interest than short-term ones, because you're locking your money up for longer. When that flips — when short-term rates climb above long-term rates — it's called an inversion, and it's the bond market quietly screaming "a recession is coming." The yield curve has inverted before basically every U.S. recession since the 1950s. In 2006, it inverted. Nobody panicked.
Then through 2007, credit spreads started widening — which is finance-speak for "lenders are getting nervous and demanding more to take on risk." Bear Stearns shut down two of its mortgage hedge funds in mid-2007. The cracks were visible. And the stock market's response? It made that brand-new all-time high in October 2007 anyway. Of course it did. That's what tops do — they don't ring a bell, they throw a party.
02 2008: the slow-motion collapse
The unwind didn't happen all at once. That's the part people forget. It came in waves, each one dismissed as "contained" right up until the next one hit.
03 The part that should keep you up at night
Here's the uncomfortable truth. Nobody was hiding the warning signs. They were public. The yield curve inversion was in every newspaper. Home prices rolling over was a matter of record. Credit spreads widening was visible to anyone who looked at a screen. The information was free.
People just didn't want to look. Because looking meant selling, and selling meant missing out, and missing out — while your neighbor brags about his portfolio at a barbecue — feels worse in the moment than a hypothetical crash that might never come. That's not a finance problem. That's a human problem. And it repeats every single cycle.
Why this matters now
The exact signals that flashed before 2008 — the yield curve, credit spreads, valuation extremes, the fear gauge — are the same indicators our AI analysts track today, live. You can watch them yourself instead of finding out at the barbecue. See the current readings →
The point of studying 2008 isn't to scare you into selling everything. It's the opposite. It's to show you that crashes are legible — they leave fingerprints, the same fingerprints, every time. You don't need a crystal ball. You need to be willing to look at the dashboard when everyone else is looking away.
Hover or tap an analyst to hear their take
ZEUS · MACRO STRATEGIST
"The Fed hiked into a leveraged housing market and the yield curve inverted right on schedule. That's the regime change, in writing. Macro never whispers — people just refuse to hear it until the bill arrives."
LUNA · CYCLE ANALYST
"Every cycle dies the same way: the longer the run lasts, the more everyone forgets runs end. 2008 was year five of that amnesia. The pattern was textbook — it always is, right up until it's obvious."
PYTHIA · ORACLE & FORECASTER
"I have seen this shape before. The dominoes stood in a row for eighteen months. 2008 did not arrive — it had been arriving the entire time. The fall is never sudden. Only the noticing is."
Where do the signals stand today?
The same indicators that preceded 2008, scored live by six AI analysts.
Check the Crash Meter →